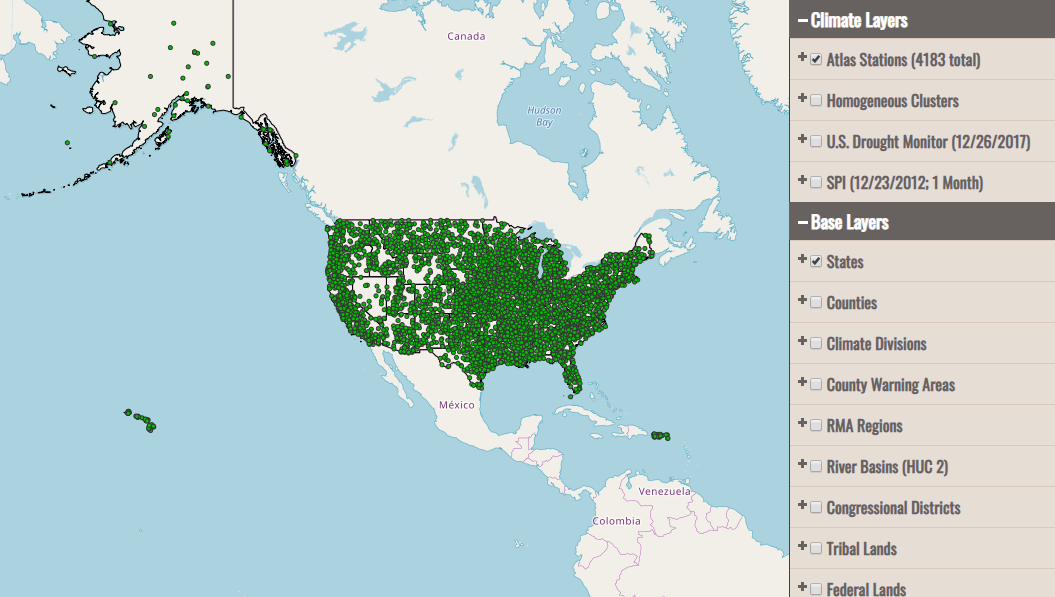
The Map Viewer displays gridded drought indices and other basic information such as the locations of the stations used in the Drought Risk Atlas. It is divided into two main areas: the map area, and the layers area.
To display a layer on the map, click on the check box next to the layer name. The selected layer will then be loaded on the map.
Displaying Climate Layers
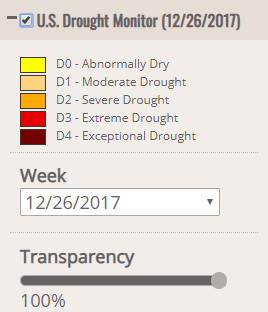
The climate layers mainly consist of the different drought indices and also the basic atlas stations and clusters. Each of the drought indices layers provides the option to select a specific time period and timestep.
There is also a transparency control for each of these layers which can be set anywhere between 0% and 100% visible.
Displaying Base Layers
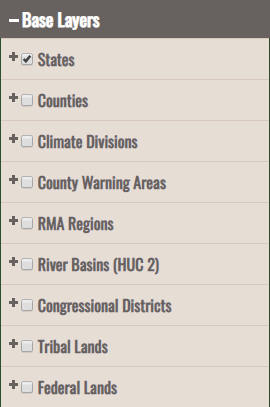
Multiple base layers can be displayed on the map. These include Counties, Climate Divisions, County Warning Areas, RMA Regions, River Basins, Congressional Districts, Tribal Lands and Federal Lands. These layers will be displayed underneath the climate data.
It is possible to select the type of river basin by hydrologic unit code. Options for 2-digit, 4-digit, 6-digit and 8-digit hydrologic units are available.