Select a Data

Once the data section of the page has been opened, a number of tabs will appear. Each of these tabs contains a set of tools for exploring different types of data. Also note that not all of the tabs will be visible depending upon the type of station and dataset selected.
General Tools
Information Panel
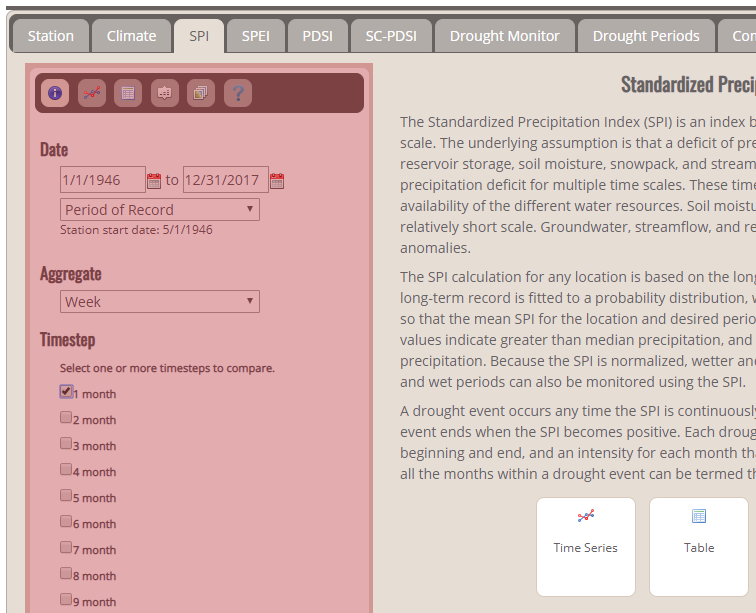
After you select the type of data you would like to view, select the associated options from the information panel, such as start and end dates, aggregates and timesteps. These will be automatically applied when you select one of the tools.
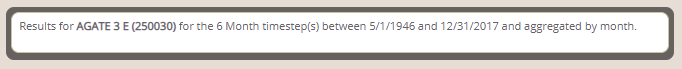
Status Bar
The status bar shows which station and parameters are currently being displayed for the active data tool.
Station Tools
These tools will provide various types of information about the selected station. Each of these tools is located in a toolbar in the information panel.

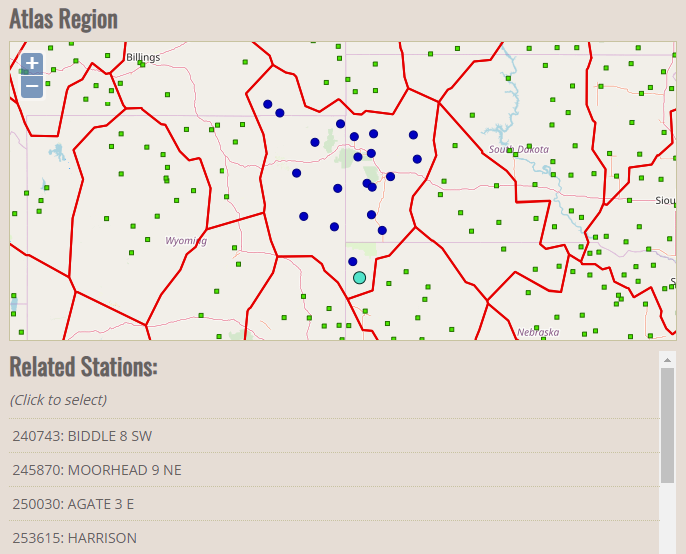
Similar Stations
This tool displays a map and the list of the other stations with the same cluster as the currently selected station. It is possible to select a new station by clicking on the desired station in the list and then clicking “Select this station”. The selected station will also appear in yellow on the map. Note that it is only possible to select a station from the current station’s cluster. If you would like to select a station in a different location, use the red “Select New Station” button at the top of the screen.
Related Links
This tool provides a list of resources related to the currently selected station. The information for the station’s state climatologist will also be displayed if available.

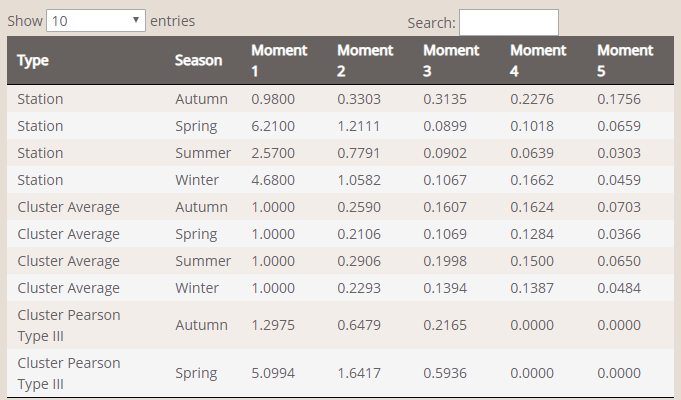
L-Moments Statistics
This tool provides the l-moment statistics of the station for each of the four seasons.
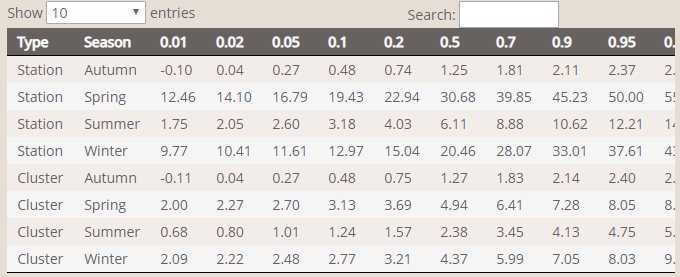
Quantiles
This tool shows the various quantile values for this station for each of the four seasons.
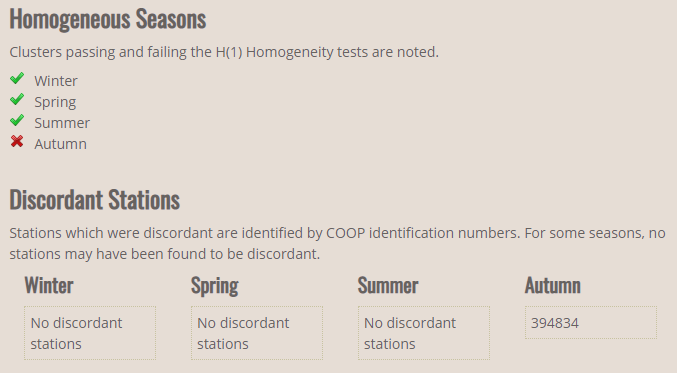
Region Discordancy and Homogeneity
This tool shows which seasons are homogeneous for the currently selected station’s cluster. It also shows if any stations in the cluster are discordant during each of the four seasons.
Climate Data Tools
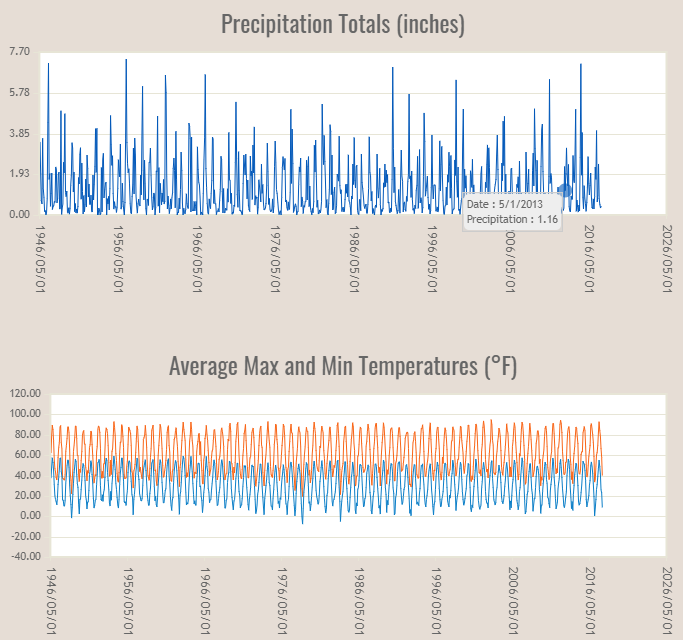
Time Series Plot
The Time Series Plot tool will plot the values of precipitation and temperature (if available) for the selected time period and data aggregate. It is also possible to zoom in on the chart by clicking and dragging the cursor.
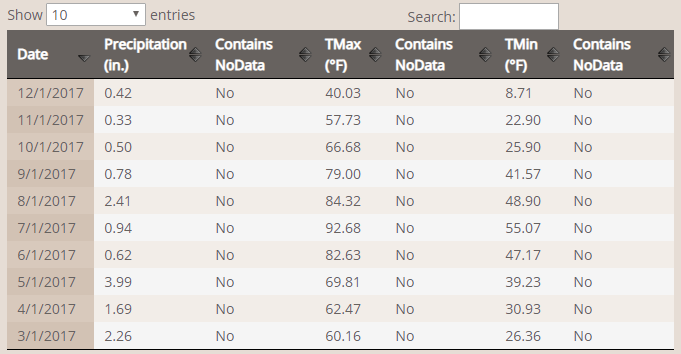
Time Series Table
The Time Series Table tool will display tabular precipitation and temperature data for the selected time period, timesteps (if available), and data aggregate. It is possible to sort the data by a selected column in either ascending or descending order.
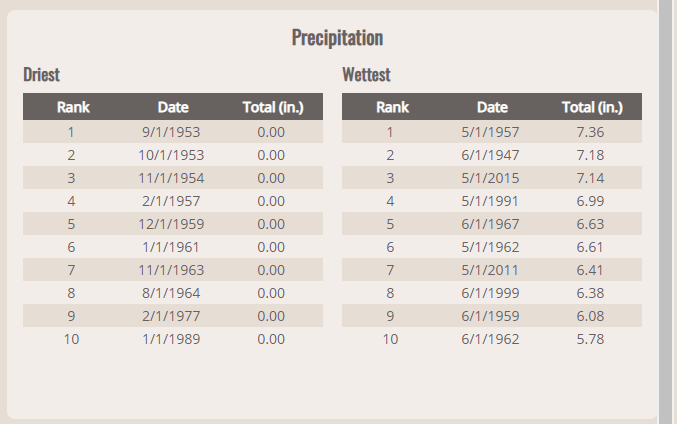
Analog Rankings
The Analog Rankings tool displays the highest and lowest values for precipitation and temperature.
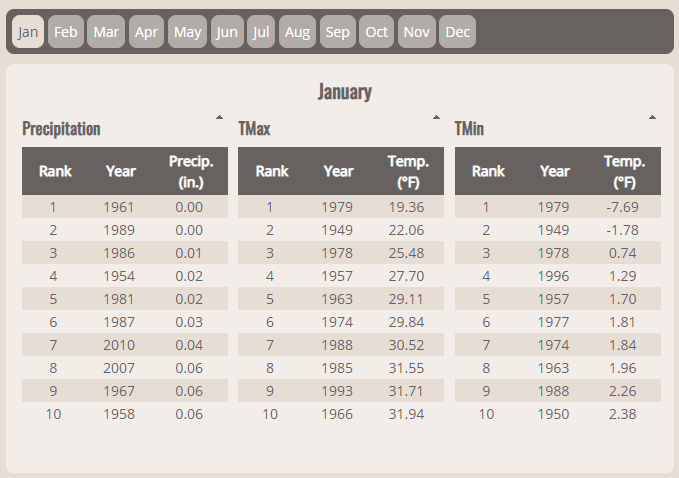
Monthly Analog Rankings
The Monthly Analog Rankings tool displays the highest and lowest values for precipitation and temperature for a selected month. Note that the data aggregate will automatically be switched to "Month" when this tool is selected.
Indices Tools
These tools are located within the sections for drought indices including the Deciles, SPI, SPEI, PDSI, self-calibrated PDSI and USDM.
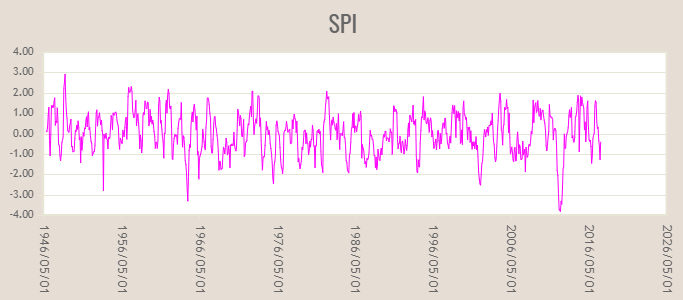
Time Series Plot
The Time Series Plot tool will plot the values of the drought index for the selected time period, timesteps (if available), and data aggregate. It is also possible to zoom in on the chart by clicking and dragging the cursor.
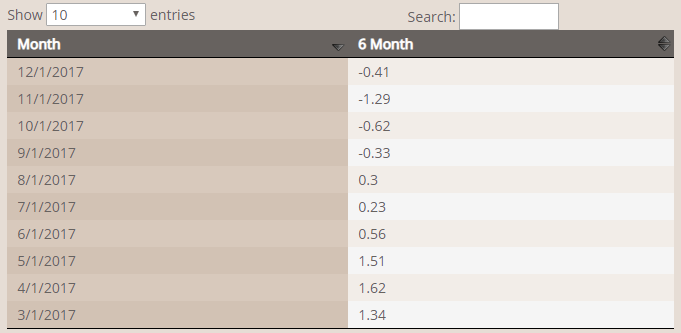
Time Series Table
The Time Series Table tool will display tabular data for the selected time period, timesteps (if available), and data aggregate. It is possible to sort the data by a selected column in either ascending or descending order.
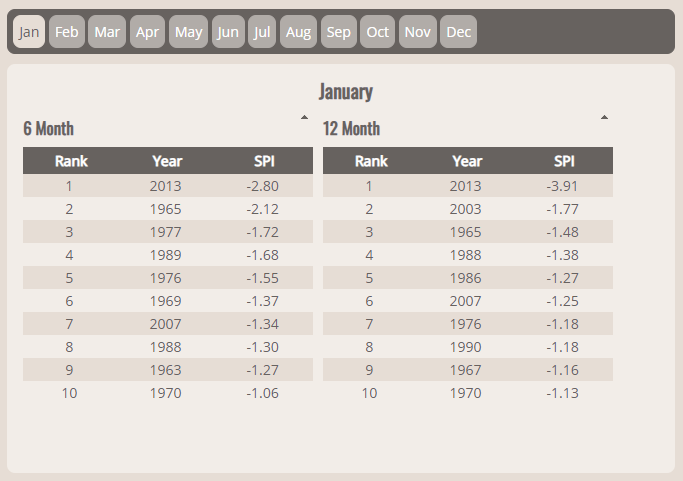
Analog Rankings
The Analog Rankings tool displays the highest or lowest monthly values of the index for the selected time period, timesteps (if available), and data aggregate. The order of display can altered between greatest and least for each timestep chosen.
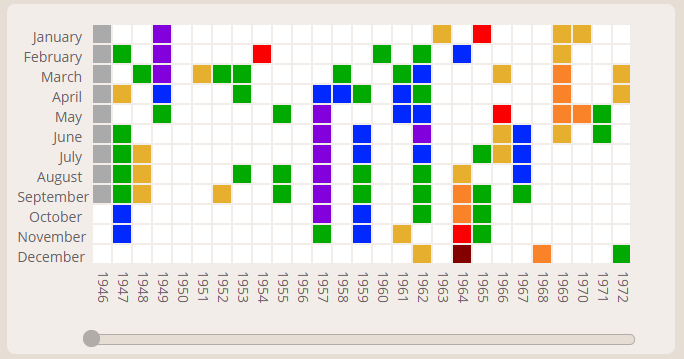
Heatmap
The Heatmap tool is a graphical way to display the data values of the index. The data will be displayed for the time period and aggregate chosen. Also note that only one timestep can be displayed and the first selected timestep in the list will be used for indices that have multiple time steps available.
Drought Periods Tools
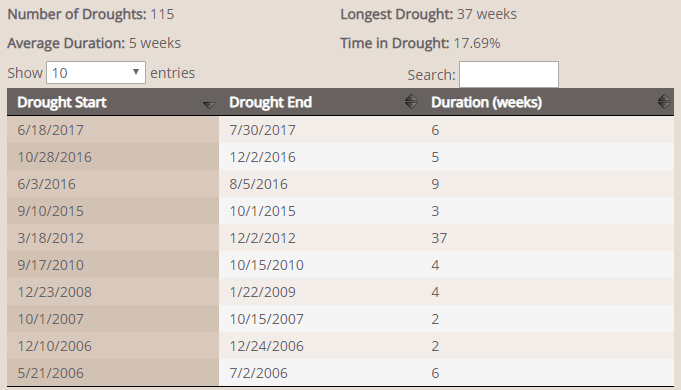
Drought Periods Table
The Drought Periods Table tool displays the drought periods for the selected time period, drought index, drought classification and timestep. It is possible to sort the data by a selected column. Other statistics such as the number of droughts and the longest drought period will be displayed.
Drought Index Comparison Tools
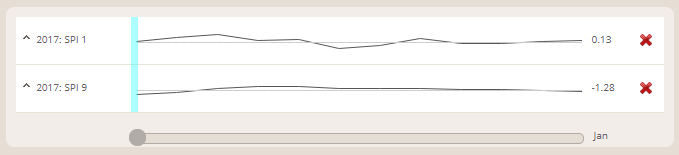
Compare Indices
The Compare Indices tool will allow you to compare multiple drought indices for multiple time periods. Up to six different comparisons can be made. Select a year, index, and timestep (if needed) and click the “Add Index” button. The chosen index will appear on the screen.
Drought Frequency Tools
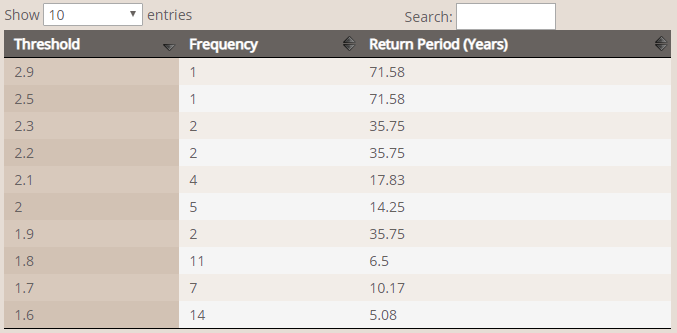
Frequency Statistics
The Frequency Statistics tool displays the frequency of occurrence of a certain drought level for the chosen drought index, aggregate and timestep over the period of record of the station. The number of occurrences and the return period (number of years between occurrences) are given for each threshold.