Concept
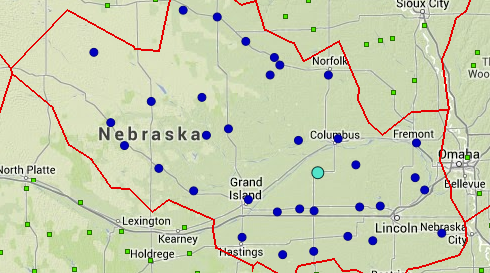
The concept behind conducting a cluster analysis of all the stations was to develop homogenous climate regimes that each station would be part of. Grouping like stations together and testing them statistically will allow the user to have an idea of stations that are similar to the one(s) they are interested in and have confidence that surrounding stations can be used in decision-making processes based upon their climate regime.
Process
The cluster analysis consisted of grouping stations together based upon each station's latitude, longitude, elevation and precipitation characteristics. The precipitation characteristics were developed for each season (winter, spring, summer, and autumn), so we had the ability to cluster the stations based upon data from any of the seasons. We decided that the summer season, because of the widespread convective nature of precipitation, would be our best choice to determine our clusters. We acknowledged that this is not true for all regions of the United States, but were satisfied with the results.
In the final cluster analysis based upon the station attributes and the summer precipitation characteristics for each station, 139 unique clusters were developed. The average cluster size contained 22 stations and the range of cluster populations was from 5 to 49 stations. As the clusters were being developed and stations were being placed into their clusters, statistical tests were conducted for homogeneity and discordance. After the 139 clusters were decided upon, only 37 points in clusters were considered discordant for the summer precipitation (1.21%). Discordance was tested using the clusters developed for the summer season, but with the precipitation characteristics of the other seasons. For autumn, there were 80 discordant points (2.62%); for spring, 84 discordant points (2.75%); and for winter, 75 discordant points (2.45%). These results were considered acceptable as it was noted that several points were discordant for any cluster they were put into, they were put into the cluster that made most sense geographically. We could have dismissed these stations from the Drought Atlas, but we felt that if the stations were of high quality data, we did not want to discharge any stations if we did not have to.
Homogeneity Tests
Homogeneity H (1), tests were conducted upon each cluster as well, based on the clusters developed using the summer precipitation characteristics. Using a Monte Carlo simulation, with 2000 simulations being conducted for each season, the homogeneity of the clusters was tested. For the summer season, 9 of the 139 clusters failed the homogeneity test (6.45%). Of the clusters that failed, many were in the western United States where the summer season is dry and not the most ideal period of the year to look for similarity in station records, as a precipitation event is the anomaly. For autumn, 35 clusters did not pass the homogeneity test (25.2%), spring had 20 failures (14.4%) and winter 16 failures (11.5%). It also makes sense climatologically that the transition seasons of spring and autumn would have the most variability for most of the country and have the most inhomogeneities compared to the summer season. Several clusters failed the homogeneity tests for all 4 seasons. This was not surprising as some clusters were developed in terrains and landscapes that have tremendous variability, and regardless of how stations were clustered, they would not be homogeneous. Through literature reviews, this was deemed to be acceptable and part of the process of a cluster analysis.
Finalization

During the process of the cluster analysis, the clusters were offered up for critiquing by the state climatologists of the country. With feedback from this group, we did adjust and change clusters with some clusters being split into 2 or more regions. We also compared the homogeneous clusters developed for the Drought Risk Atlas with the climate divisions created by Klaus Wolter using a principal components analysis. We found that our independent results compared nicely to his work, which satisfied our needs for our clusters.